Portfolio clarity,
without the spreadsheet work

Bring your property reports into one workspace. Compare performance, investigate budget variances, and give owners and investors a clearer picture.

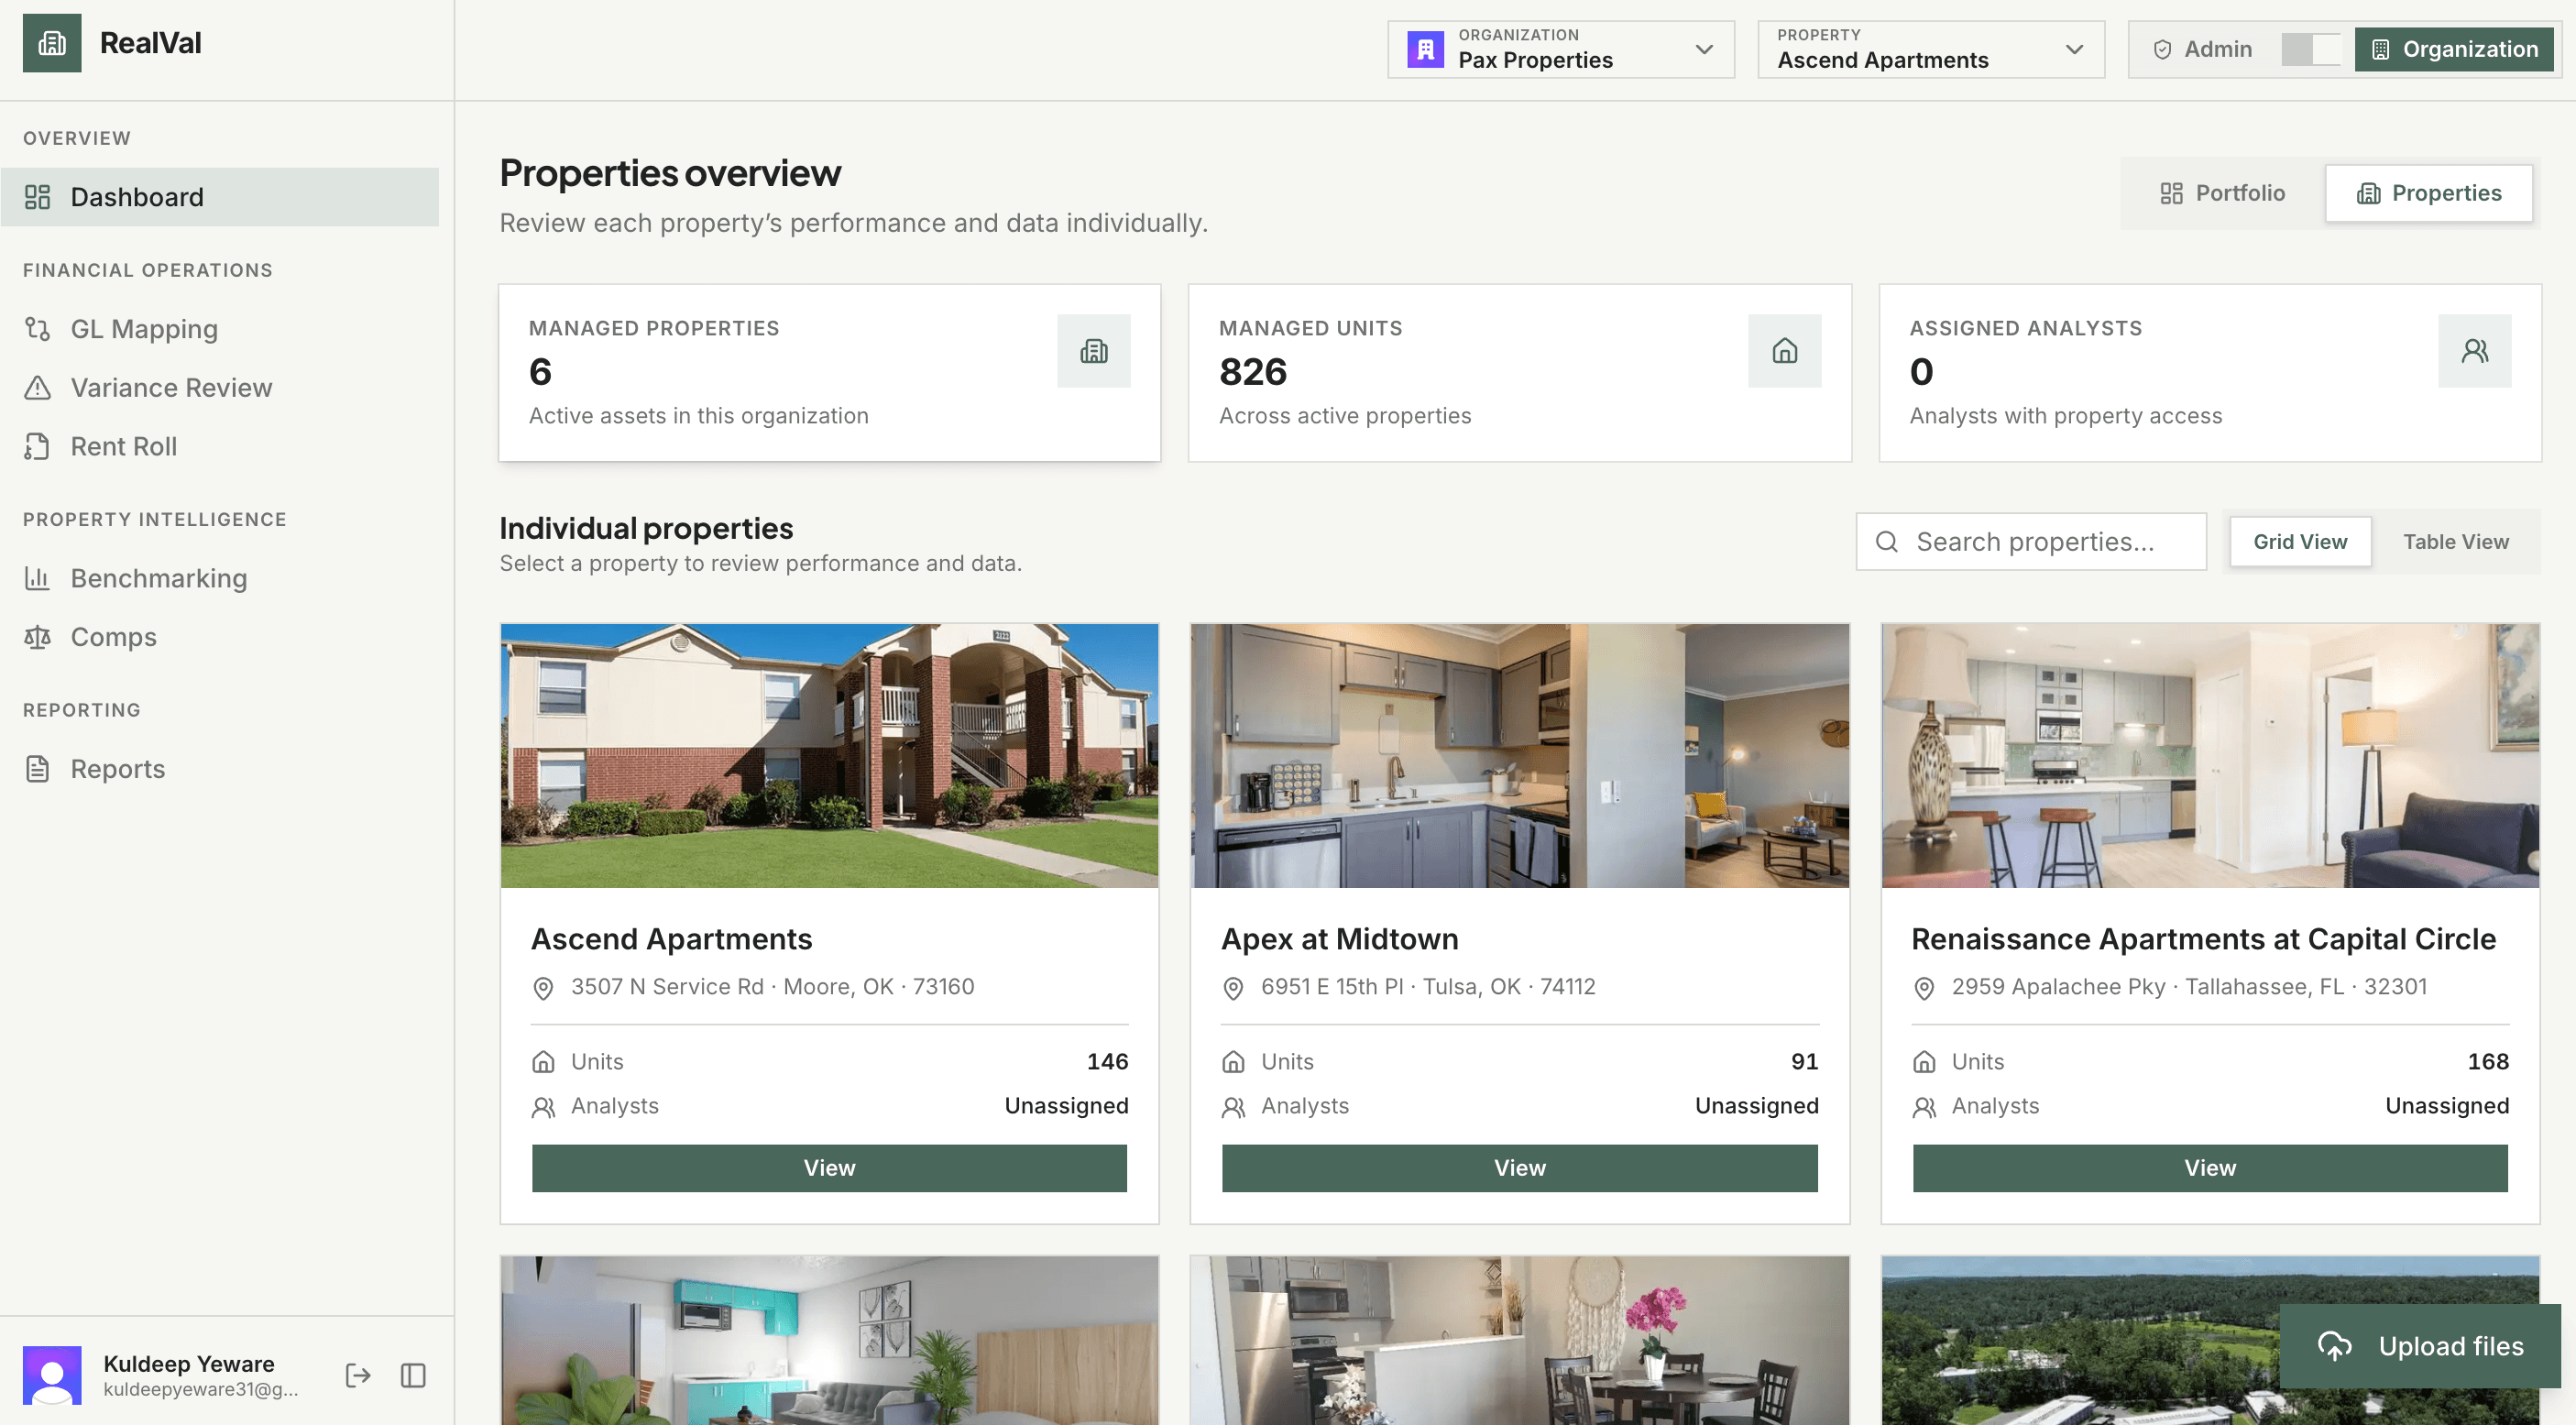
RealVal dashboard showing portfolio metrics and individual properties

One portfolio.
Different systems.

Yardi at one property. ResMan at another. Before you can compare performance, you’re matching categories and reworking spreadsheets.

Every property, every system,
in one view

Bring scattered reports into a shared workspace for financial and rent-roll analysis, portfolio comparisons, and investor reporting.

Compare any two properties, whatever system they came from

Map each report’s line items to shared categories automatically, so a Yardi T-12 and an AppFolio export line up without manual rework.

Ask AI anything about your portfolio, from insights to strategy

Ask about expenses, vacancy, and lease expirations using your uploaded data. Review the answers with your team.

See which assets need attention at a glance

Rank your whole portfolio by occupancy, NOI, or variance to plan, and the underperformers surface immediately.

See exactly where you’re off budget — and why

RealVal flags every line where actuals miss plan, then drills into the categories driving the gap, so you walk into the variance conversation already knowing the cause.

Turn every rent roll into a leasing action plan

Track occupancy and rent trends, new leases versus renewals, upcoming rollover, and unit-level loss-to-lease. Prioritize the biggest revenue opportunities, ask AI for context, and export the analysis.

Keep forecasts current

Bring actual results into your pro forma and review AI suggestions as your assumptions change.

Know where every floor plan sits in the market

Scan nearby properties, curate the right comp set, and compare rent, price per square foot, unit mix, and amenities. See market position and loss-to-lease without rebuilding a spreadsheet.

Investor reports in minutes, not a weekend

Bring financials, charts, and your commentary together in PDF reports that explain property performance.

From reports to decisions.

Three steps from raw Excel export to a decision you can act on.

01

Upload your reports

Start with the Excel exports you already use. Add them to the right property’s workspace.

02

AI organizes the data

RealVal extracts the numbers, categorizes line items, and standardizes each report automatically—with your team in the loop for a quick final review.

03

Put insights to work

Investigate variances, update forecasts, and turn your findings into reports you can share.

See RealVal in action.

Walk through the portfolio view, variance drill-down, AI insights, and investor reports.

RealVal dashboard showing portfolio metrics and individual properties

Start with the big picture.

Review portfolio metrics, then open any property to see its financial and leasing details.

Questions,
answered.

What to know about access, uploads, and working with your data.

Access is by invitation. Ask your organization’s admin to invite you, then use the link in your email to create your account. Already a member? Sign in to your workspace.

Less spreadsheet work.
More time for decisions.

See how RealVal turns property reports into portfolio-wide clarity for your team.